Reading a 30-Second MES Chart: Double Bottom, Trendline and Levels (Case Study)
WickScan Research
WickScan
About this case study. This is one chart that we, the WickScan team, scanned ourselves during a single session. It is not a customer's scan, and one example says nothing about how often a read like this works out. WickScan doesn't publish accuracy or win rates. What you can take from it is how to read the marks on a fast intraday chart.
The chart is the Micro E-mini S&P 500 (MES) on a 30-second timeframe, with price chopping in a 6,451–6,475 range. We uploaded a screenshot mid-session.
What WickScan marked
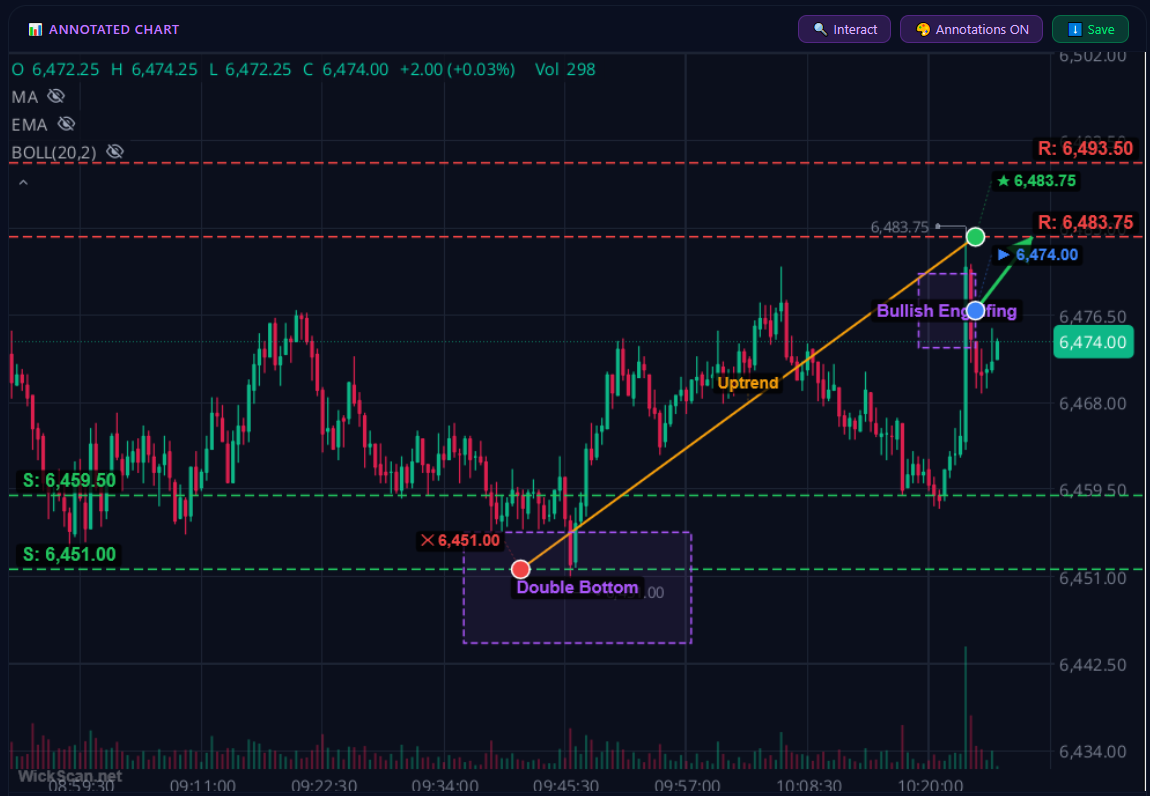
Double bottom near 6,451
Price tested 6,451 twice and failed to break lower both times. That's the shape of a double bottom: a level where sellers ran out of follow-through twice. WickScan boxed the two lows and marked 6,451 as the support that mattered. If price had closed back below it, the pattern would have been void.
The trendline
After the second low held, the higher lows that followed let WickScan draw a rising trendline. A trendline on a 30-second chart is fragile, and one decisive break undoes it. Treat it as a description of the move so far, not a promise about the next one.
Bullish engulfing candle
Further up, a green candle fully covered the red candle before it: a bullish engulfing pattern, which shows buyers absorbing the selling in that moment. On a fast timeframe, an engulfing candle is a detail inside the structure, not a reason to trade on its own.
The levels
- R2: 6,493.50 — upper resistance
- R1: 6,483.75 — first resistance, the session high at the time
- S1: 6,459.50 — intermediate support
- S2: 6,451.00 — the double-bottom support
These are read from the chart's own price axis. That's why they land on real prices rather than on rounded guesses.
What price did next
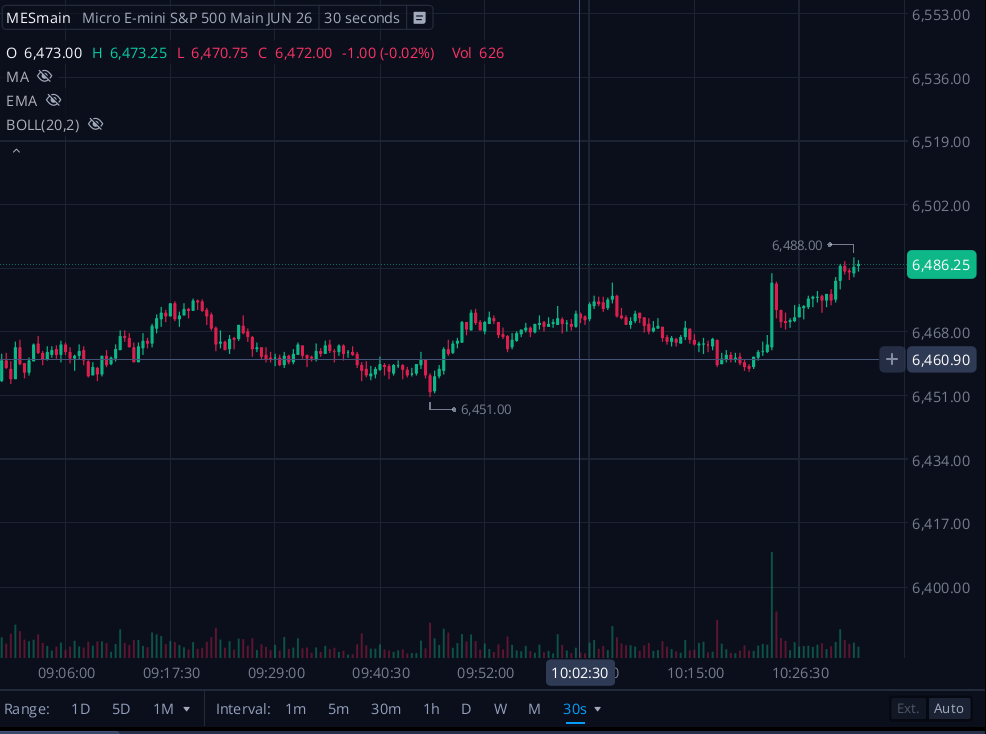
Later in the session, price traded up from the 6,451 area through R1 to a high near 6,488, about 37 points on MES. It stopped short of R2.
That outcome is one session. The same marks on another day can resolve the other way: a double bottom fails when its support breaks, and on a 30-second chart that can happen in a few candles. The useful part is the structure. The read tells you where the idea is wrong (a close back under 6,451), where the first obstacle sits (R1) and where the next one is (R2). That's what you would size and manage a trade around.
How to use a read like this
Start with the level that would prove the idea wrong. Here, 6,451. Note the obstacles between price and any target, here R1 and R2. Treat patterns as context. The double bottom and the engulfing candle describe what buyers did. They don't guarantee what comes next.
WickScan is an educational chart-analysis tool, not financial advice, and futures trading carries a substantial risk of loss. Upload a chart of your own to see how the read marks its structure.
Related: AI futures chart analysis and a free position size calculator for MES and ES.
Disclaimer: This article is for educational and informational purposes only. It does not constitute financial advice. Trading involves risk of loss. Always do your own research before making trading decisions.
Sharpen Your Edge
Upload any candlestick chart and get AI-powered pattern recognition, support/resistance levels, and trade considerations in seconds.
Try WickScan FreeProduct updates live on the WickScan blog.